
Our statistical expertise involves
Design of Experiments (DOE)
Quality by Design (QBD)
Process capability analysis
Statistical analysis and extrapolation of stability data
Statistical analysis and models for validation of analytical methods
Process Performance Qualification (PPQ)
Out-of-specification (OOS) and out-of-trend (OOT) analysis
Design of Experiments (DOE)
DoE studies can help develop process knowledge by revealing relationships of multivariate interactions, between variable inputs (e.g., component characteristics or process parameters) and resulting outputs (e.g., in-process material, intermediates, or the final product). The results of DOE studies can provide justification for establishing ranges of incoming component quality, equipment parameters, and in-process material quality attributes.
Application of DOE allows studying multiple factors at once as a systematic series of parallel experiments simultaneously. Parallel experiments are economical in terms of time, money and efforts to maximize information with minimum runs. Purposeful changes are made on input factors to identify causes for significant changes in output responses and to determine the relationship between factors.
Application of DOE:
- Development of new products and processes
- Enhancement/ optimization of existing products and processes
- Optimization of quality and performance of a product
- Optimization of an existing manufacturing procedure
- Screening of important factors
- Minimization of production cost
- Robustness testing of products and processes
RD&C provides support in designing and implementing DOE to different processes in drug development. Factors such as ranges of incoming component quality, equipment parameters, in-process material quality attributes, process parameters etc. are evaluated and critical response values defined.
Quality by Design (QBD)
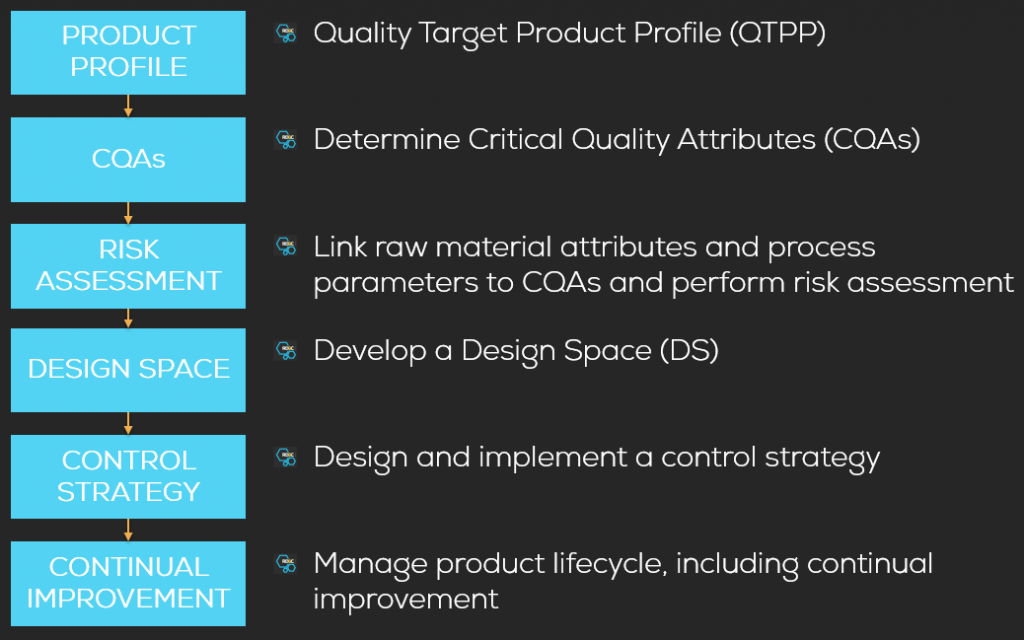
A design space is defined as the multidimensional combination and interaction of input variables (e.g., material attributes) and process parameters that have been demonstrated to provide assurance of quality. As such, a design space is built upon multivariate experimentation and process understanding. It involves systemic approaches in the various drug development processes to building in quality in processes rather than testing. Hence, QBD involves a more scientific, risk based, holistic and proactive approach to drug development that begins with predefined objectives and emphases product and processes understanding and process control. Traits and capability are built into a process to ensure expected and intended performance.
Implementation of QBD is required by regulatory authorities and is reflected in various guidelines (ICH Q8, ICH Q9, ICH Q10). RD&C offers support in implementing QBD in development processes, starting from the definition of desirable traits (Critical Quality Attributes CQAs), the creation of Quality Target Product Profile (QTPP) used to determine the focus for creating the design space.
Process capability analysis (PCA)
RD&C provides analyses performance and evaluates the capability of a process i.e. the ability of a process – based on historical performance – to achieve measurable results that satisfy established specifications and statistical limits. Process capability indicates how well a process is able to perform its specified purpose. We analyse acceptance sampling strategies and support sample size determinations on sound statistical basis.
Process Performance Qualification (PPQ):
RD&C analyse your data to demonstrate acceptability of the developed formulation and manufacturing process. PPQ evaluates the process design and development work and demonstrates that the commercial manufacturing process performs as expected, reproducible and will consistently deliver products of the expected quality.
RD&C supports you in the identification and integration of key parameters:
- Understanding the sources of variation
- Detection of presence and degree of variation
- Understanding the impact of variation on process and ultimately product attributes
- Controlling variation in a manner commensurate to the risk it represents to process and product
Evaluation and extrapolation of stability data:
According to the ICH guideline Q1E stability data may be used to propose a retest period or shelf life longer than covered by experimental data. The true product shelf life is never known but can be estimated based on product parameters and experimental data. If the estimation method is unbiased and precise, the estimate should be close to the true, evaluated and demonstrated by sound statistics. The degree of variability of individual batches affects the confidence that a future production batch will remain within acceptance criteria throughout its retest period or shelf life. RD&C applies regulatory compliant statistical tools to analyse experimental data to evaluate when and how extrapolation can be considered to define a retest period for drug substance and shelf life for drug product longer than covered by experimental data.
Statistical analysis and models for validation of analytical methods
Validation of an analytical method is to demonstrate that the method is suitable for the intended use, such as evaluation of a known drug for potency, impurities, etc. The intent of method validation is to provide scientific evidence that the analytical method is reliable and consistent before it can be used in routine analysis of drug product. According to the ICH guideline Q2(R1), ”Validation of Analytical Procedures: Text and Methodology”, analytical method validation provides requirements to demonstrate method specificity, accuracy, precision, repeatability, intermediate precision, reproducibility, detection limit, quantitation limit, linearity, range, and robustness.
Out-of-specification (OOS) and out-of-trend (OOT) analysis
OOT results are defined as a stability result that does not follow the expected trend, either in comparison with other stability batches or with respect to previous results collected during a stability study. OOT results are not necessarily OOS, but they do not look like a typical data point. To judge whether a particular result is OOT, one must first decide what is expected and in particular what data comparisons are appropriate. Two general approaches are commonly applied to identify OOT data: Evaluation of data within a batch to determine whether that batch is following the same trend across time as indicated by data for earlier time points, and to look across historical stability batches to determine whether the batch under study is following the same trend as other batches of the same product.